Review
GRE Data Analysis - Box Plots
On the GRE exam, you may be asked to interpret a data set using one of several graphical representations of the data. One convenient way to describe a data set is to use a box plot (also known as a box-and-whisker diagram or plot). A box plot graphically displays groups of numerical data through their five-number summaries: the smallest observation (sample minimum), lower quartile (Q1), median (M), upper quartile (Q2), and largest observation (sample maximum). The quartiles of a set of values are the three points that divide the data set into four equal groups, each representing a fourth of the population being sampled. The box plot is often called a "whisker" plot because "whiskers" extend outward from the boxes to the least and greatest values. Graphically, a box plot looks like the following:
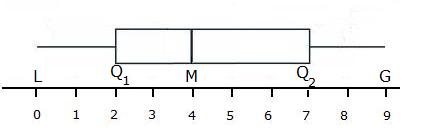
Sometimes, the Median is denoted as Q2, and the upper quartile is denoted as Q3. In the above box plot, the median is 4, the sample minimum is 0, the sample maximum is 9, the lower quartile is 2, and the upper quartile is 7.
A measure of the dispersion of the data that is shown in a box plot is called the interquartile range, which is the difference between the upper quartile and the lower quartile. In the above box plot, the interquartile range is 7-2=5.
The below box plot is for the following set S of points:
S = {1, 2, 3, 4, 4, 8, 8, 8, 8, 9, 9, 10, 10, 10, 10, 10}
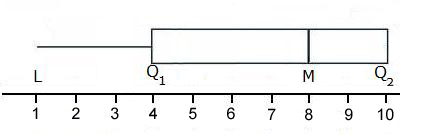
Question: What is the interquartile range for S?
- 1
- 4
- 5
- 6
- 9
Solution: If you are familiar with box plots, then the following details are easily calculated:
- The lowest data point is 1
- The lower quartile is 4
- The median is 8
- The upper quartile is 10
- The largest observation is 10
- The range is 10-1 = 9
- The interquartile range is 10-4=6
Thus the answer is D.