Review
GRE Data Analysis - Normal Distribution
The normal distribution is a pattern for the distribution of data which follows a bell-shaped curve. The normal distribution is called normal because the data points are concentrated in the center near the mean, the data does not usually contain extreme values, and the probability of deviations of the data points from the mean are (nearly) identical in either direction. Graphically, the normal distribution looks like the following:
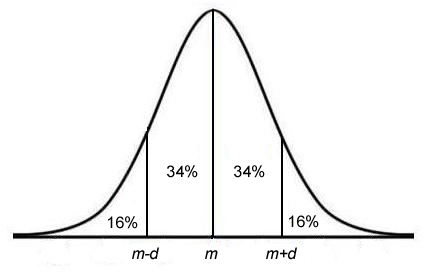
Where m is the mean, and m+d and m-d designate one standard deviation greater and less than the mean. The percentage values in the above figure indicate what percentage of the data fall into that region. GRE data analysis questions that measure your understanding of the normal distribution may or may not provide you with a plot (as above).
All normal distributions satisfy the following properties:
- Approximately 68% of the observations fall within 1 standard deviation of the mean
- Approximately 95% of the observations fall within 2 standard deviations of the mean (not shown in above figure).
- The mean, median, and mode of the data are nearly all equal
Question: Stats-R-Us laboratories has conducted a survey to determine how many strawberries are eaten by 100,000 people during a one year period. The data indicate that the number of strawberries eaten is approximately normally distributed with a mean of 29 strawberries, and a standard deviation of 4 strawberries eaten by each person. According to this data, approximately how many of the surveyed people ate more than 25 strawberries during the course of the year?
- 16,000
- 48,000
- 50,000
- 68,000
- 84,000
Solution: According to the definition of a normal distribution, two-thirds, or about 68%, of data are within 1 standard deviation of the mean. The mean is 29, with standard deviation of 4, so 68,000 people (68% of 100,000) ate between 25 and 33 strawberries. Because the normal distribution is symmetric around the mean, then 16% of the data points are more than 1 standard deviation. 16% of 100,000 is 16,000, so 16,000 people ate more than 33 strawberries. Using these values, 16,000 + 68,000 = 84,000 people ate more than 25 strawberries, so the answer is E.